This is a guide on how to sketch professional-looking diagrams for your IB Economics Internal Assessment
There are hundreds of applications (web-based as well) one could use to sketch proper economics diagram which could be used for your Internal Assessments. We personally found using Google Drive – Drawings to be one of the best methods and this guide will show you how to use it. There are numerous advantages to using this application: your diagram will always be saved and accessible (i.e. if your IA goes missing), they are easy to share, works on any operating system (Windows, Mac OS, Linux, etc.).
1. Access Google Drive and create a drawing
Google’s explanation of how to do that:
- Go to Google Drive at drive.google.com.
- Click New in the top left, hover over More, and choose Google Drawings.
- Don’t see New? You may have an older version of Drive. Try clicking the Create button in the top left > choosing Drawing.
- A drawing will automatically be created.
2. Select the “Line” tool
![]()
3. Draw! (Hold the SHIFT button to make straight lines)
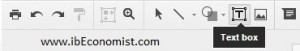
4. Add a heading and name your axis using the text tool
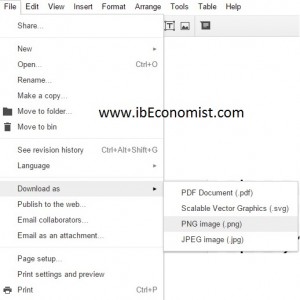
5. When the job is finished, download your economics diagram in the appropriate format (png recommended):
Useful additional information:
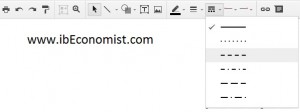
- Make the lines dashed by selecting a line and choosing a different pattern:
- If you want to be as precise as possible with your economics diagram (Good idea!) you can zoom in: