Consumer Surplus
Definition: Consumer surplus is the difference between what the consumer was willing and able to pay (the demand curve) for a good or a service and what he actually paid (the market price).

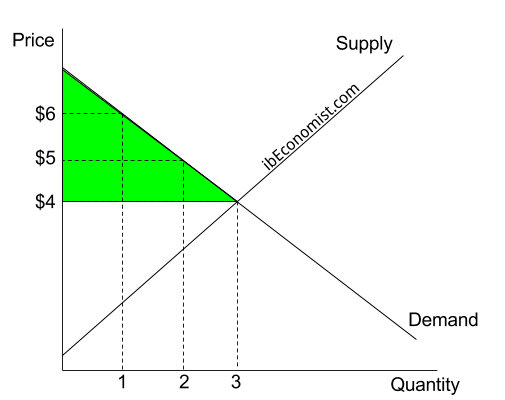
To explain this concept we will use the diagram above and an example – beer. Chris is a university student and he likes going out on Fridays. He also likes beer. On any Friday evening he wants the first beer so much he is willing to pay $6 for a bottle. After he downs that first beer in one go, the second one will not bring him as much “satisfaction” so he says he is willing and able to pay $5 for the second bottle. Chris will only get another (3rd) beer if its price is $4. The 4th one will bring him pretty close to throwing up (maybe he’s a skinny guy or just doesn’t take alcohol very well) so he would only purchase it if it was priced at $3. These are points A, B, C, D. They show how much each bottle of beer is valued by the consumer or in other words – how much “satisfaction”/”happiness” in monetary terms each beer would provide.
When Chris actually goes to a bar, he sees that the beer is priced at $4 per bottle. When buying his very first bottle, how much was Chris willing to pay? $6. How much does he pay? $4. Looking at the definition of the consumer surplus we can say that the consumer surplus from the first beer was $6-$4=$2. Will Chris purchase the second beer? He values it at $5 and the price is $4, meaning he will. And the consumer surplus derived from it? $1 ($5-$4). 3rd beer? Yes! Because Chris values the beer at $4 and it costs $4. However, the addition to consumer surplus will be zero. What about the 4th beer? Chris values the 4th bottle at $3. The price is $4. He will not purchase the 4th beer. Chris thinks: “The marginal benefit I get from the next beer will be $3 but it would cost me $4. Buying it would be irrational!”
Total consumer surplus is the area under the demand curve and limited by the market price (coloured green in the diagram below):

Question: why the long story when you can learn the definition, do the maths, show CS on the graph and that’s it? Because if you UNDERSTAND what consumer surplus is, you will never have to memorise definitions, formulas or graphs. The “story” about Chris shows that you can think about consumer surplus like being “extra utility” he did not have to pay for. He got $6 worth of “satisfaction” for $4 when he bought the first beer. The second bottle gave him $5 worth of “happiness” for a price of $4. You get the idea.