Definition:
- Indirect tax – is a tax placed on the producer (his produced goods and/or services) which is then (partly) passed on to the consumer in a form of a higher price.
There are two types of indirect taxes you need to know for your IB Economics course:
- Specific tax – a fixed monetary value added on every unit of produce. e.g. $5 tax placed on every packet of cigarettes in an attempt to decrease consumption.
- Ad valorem tax – a percentage tax placed on a good or a service. e.g. VAT (Value Added Tax) is the best known example of an ad valorem tax. In the UK it is currently at 20%.
It is important to note that on a diagram both of these taxes will affect the supply curve differently. A specific tax will shift the supply curve vertically up by the size of the tax. An ad valorem tax will make the new supply curve diverge from the original (the vertical gap between the two supply curves will increase when moving along the X axis – click here for examples).
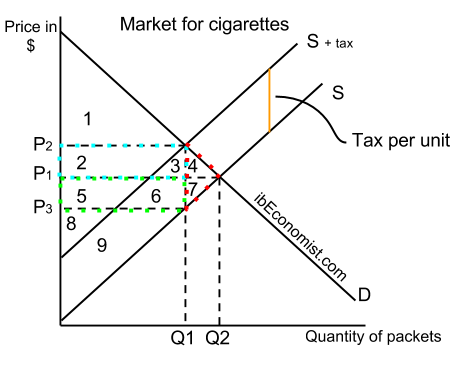
The market equilibrium is at quantity Q2 and price P1 where demand D intersects supply S. Once an indirect tax of size P2-P3 (also represented by the orange line) is introduced the supply curve shifts from S to S+tax. Supply extends and demand contracts until a new equilibrium at quantity Q1 and price P2 is reached.
Total tax revenue: per unit tax * quantity; sum of areas marked in blue and green; areas: 2+3+5+6
Deadweight welfare loss: area marked in red, sum of areas numbered 4 and 7
Consumer surplus:
- Before the tax: 1+2+3+4
- After the indirect tax introduction: 1
Producer surplus:
- Before the tax: 5+6+7+8+9
- After the indirect tax introduction: 8+9
Higher level economics students must understand the tax incidence: consumers pay the area marked blue while the producers pay the area marked green. It all depends on PED and PES (price elasticity of demand and price elasticity of supply).
If PED > PES (in absolute terms, because normally, PED is always < 0 and PES is always > 0):

You can see right away that the largest chunk of the tax falls on to the producer, while the consumer pays very little.
If PED < PES (in absolute terms): vice versa – the consumer will pay most of the tax.
The intuitive way to think of tax incidence: PED is probably lower than PES for cigarettes – addicted people might be charged almost anything and the quantity would fall very little. So what would the producers do if they are taxed? Simply put the whole tax on the consumer. Obviously it is the other way around when PED > PES (in absolute terms).
However, it is crucial to understand that you cannot say ANYTHING about the price elasticities of demand and supply when you know the tax incidence. You can only talk about the RELATIVE PED and PES. Consumers might pay the whole tax having a relatively price elastic demand as long as PES is sufficiently more elastic.
