Definition:
- Price floor (minimum price) – the lowest possible price set by the government that producers are allowed to charge consumers for the good/service produced/provided. It must be set above the equilibrium price to have any effect on the market.
Price floors are mostly introduced to protect the supplier. The best example for minimum prices is the labour market. People are supplying labour and to protect them from exploitation governments impose minimum wages.
Another example could be price floors in agricultural product markets (big thing in the European Union). To protect farmers governments guarantee a certain price for their harvest which is above equilibrium therefore, a minimum price. Also, not only do they set a minimum price but they guarantee to purchase most or all of their produce. This leads to constant overproduction – why would farmers change anything or produce less if there is infinite demand independent of quantity sold?
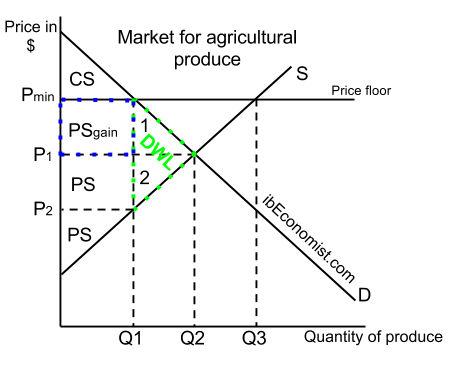
As seen in the diagram minimum price is set above the market equilibrium price. If set below the equilibrium price it would have no effect. Once introduced at Pmin the price floor will cause an excess supply (surplus) of Q3 – Q1, because quantity demanded is Q1 and quantity supplied is Q3.
Effects of a price floor on different stakeholders:
- Consumers – they are worse off in a sense that they have to pay a higher price and there is a number of people who cannot afford the good anymore. Consumers’ original surplus was the sum of areas “CS” + “PSgain” + “1”. They lose area “1” and area “PSgain” due to the introduction of minimum price.
- Producers – their original surplus was the sum of areas “PS” + “PS” + “2”. After the price floor it is the sum “PS” + “PS” + “PSgain”. Producers now receive a higher price for their goods and services. Hence, they might be considered better off.
- Consider relative price elasticities of supply and demand – they define the sizes of gained and lost producer/consumer surpluses.
- Deadweight welfare loss (social surplus lost) is marked by the green dotted line, its size is the sum of areas “1” + “2”. This signals that the scarce resources are inefficiently allocated.
Higher level students: you must be able to do calculation related to minimum price introduction: excess supply, numerical value of the DWL, numerical changes in consumer and producer surpluses.
