Definition:
- Quota – a restriction/an import barrier on the quantity or value of a particular import.
Consider the quota diagram below:
Note: there are different variations of the quota diagram, be aware of this!*
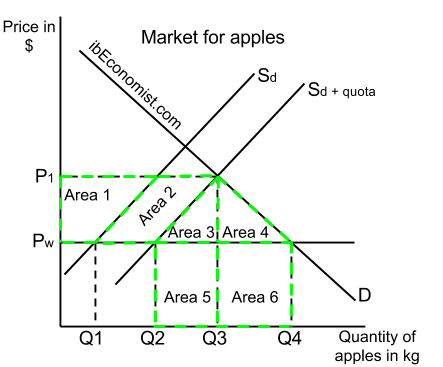
The diagram above represents the market of an economy for apples. When there are no trade barriers, the equilibrium price of apples is Pw and the quantity is Q4. Domestic supply is Sd and domestic producers supply quantity Q1, imports are Q4 – Q1. Assume the government decides to introduce a quota on apples of size Q2 – Q1 kilograms. Then the domestic supply becomes Sd + quota. Domestic supply extends Q2 -> Q3 and demand contracts Q4 -> Q3. Prices increases to P1. The new equilibrium is reached at quantity Q3 and price P1.
Effect of the quota on different stakeholders:
- Consumers: they lose consumer surplus limited by area (Area 1 + Area 2 + Area 3 + Area 4). Because the price of apples is now higher, there could be loss of possible higher living standards**.
- Government: quota has no effect on the government.
- Domestic producers: they are cheering as their producer surplus increases by Area 1 since they get to charge a higher price and sell a larger quantity (Q1 + Q3 – Q2).
- Foreign producers: the quantity they sell fell from Q4 – Q1 to Q2 – Q1. Hence, foreign producers lose revenue limited by Area 5 + Area 6. However, because of the quota they are getting a higher price than before (P1 > Pw), so surplus limited by Area 2 is gained.
- Deadweight welfare loss: due to trade barrier quota, there is social surplus lost to nobody – DWL – limited by areas Area 3 and Area 4.
** – after the quota introduction, if you want to consume the same amount of apples as before, you have to spend extra money. Before the quota, that extra money was spent on lemons. Now, you are unable to purchase lemons and are losing that vital Vitamin C! That is a loss of possible higher living standards!
* – this diagram could also be used for analysing the effect of the trade barrier – quota:

