The law of demand states that as price of a good increases, ceteris paribus (all else being equal), quantity demanded will decrease. (It also works the other way around: as price of a good decreases, ceteris paribus, quantity demanded will increase).
The law of demand explains why the demand curve is downward sloping. It shows the negative relationship between price and quantity of a good demanded, ceteris paribus. The demand curve shows what consumers are willing and able to pay for a good/service.

However, it is important to understand the difference between individual and market demands. Let us use an example. Let us say there are two IB Economics students: Tom and Jenny. They both like going for coffee after school to (mostly) procrastinate. We will assume that they both drink regular lattes (even though Tom prefers a skinny latte for some reason, maybe trying to lose weight (???)). Tom says he will buy 1 latte if it’s priced at 2.5$, 2 if the price is 1.75$ and 3 if its price is 1$. Jenny values her afternoon lattes more than Tom and will buy 1 cup at the price of 3.5$, 2 if one is priced at 2.25$ and 3 if a latte is 1.5$.
See the individual demands for Tom and Jenny on a graph:


These graphs show particular points of price and quantities. The individual demands are not continuous – they are not curves or lines. You could connect the points in both graphs and it would look like a “curve” but it would not be correct. It is impossible for Tom to buy 1.33 of latte cups if they price were 2.25$.
But looking at the graphs and the information given above, can you tell what would the total demand for latte coffees if Starbuck’s priced them at 2.2$ per cup be? Well you know Tom would buy only 1 cup and Jenny would buy 2, so the total would be 3. If you put the two graphs together, you get something closer to a “curve”:

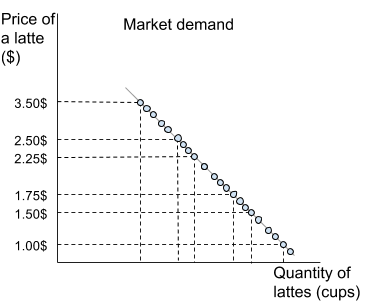
So if you take a 100 or 1000 of similar IB students each one values a latte differently. Someone would be willing to buy a cup for 5$ and buy 10 if one is priced at 1$, others would only buy a single coffee at a price of 1.7$. When you add all those individual points – they make the total market demand. Draw a line through those points and you will get the market demand curve.
Probably the most important thing to learn and understand about this topic are different changes:
- Changes in quantity demanded – mean movement along the demand curve
- Changes in demand – mean shifts of the demand curve
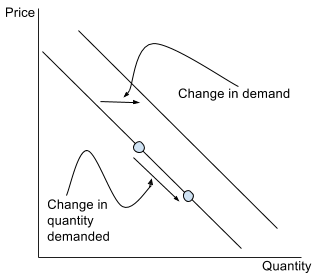
A rule of thumb: if there is a change in one of the variables which are on one of the axis (in this case quantity or price) this will mean there is movement along the curve. If the variable changing is not on the axis (income, tastes and other non-price determinants) this will lead to shifts of the curve.
Non-price determinants of demand (factors that shift the curve)
Memorise using this acronym: ICIPASTE
I – Income: income increases -> you have more money to spend -> you buy more ice cream -> demand for ice cream increases! CAUTION! income increases -> you have more money -> you buy less used clothes -> demand for used clothes decreases! The income effect on demand depends whether a good is normal or inferior.
C – Complements: let us say DVD players became incredibly popular (or cheap) again -> a complement of a DVD player is a DVD movie disc -> the demand for movies on DVDs will also increase.
I – Interest rate: interest rate falls -> it is cheaper to borrow money -> you buy more new cooking appliances or a new car
P – Population: population booms -> number of people increases -> demand for food increases as well as there are simply more people demanding food
A – Advertising: a new soap producer begins to advertise everywhere stating their product not only kills germs, but also makes you smarter, better looking and confident -> you and your friends decide to try it out (or never buy it again) -> demand for that soap increases (or decreases)
S – Substitutes: the price of Coca Cola falls significantly -> Coca Cola is a substitute for Pepsi -> the demand for Pepsi will fall as people shift to the cheaper substitute – Coca Cola
T – Tastes and Preferences: it’s 2025 and it has become incredibly “fashionable” to be as “green” as possible -> people start preferring electric cars to diesel/petrol powered cars -> the demand for the electric cars increases
E – Expectations: you expect the price of your beloved canned tuna to skyrocket in the upcoming month -> you begin stacking up on it by buying twice the usual amount -> the demand for canned tuna increases
